At Agcor, we understand that growing your business is important! You want to grow with the right people, in the right places, growing the right agricultural products. Knowing what is happening both inside and outside of your focused lending area provides you with important macro-level information in the agricultural industry.
For larger loan servicing areas, it can be difficult to understand risk since different locations experience different market conditions. Even for organizations with smaller loan servicing areas, you need to know the conditions not only in “your own backyard” but also about what is going on in the region and nation to make the right decisions for expanding your portfolio.
Getting the data you need to tell you this can be messy and time consuming, especially without standardized tools and procedures to keep up with the changes month-over-month or year-over-year.
We identified the top 3 crops by crop production valuation[1] and trended them over the last 10 years to give you greater insights into how these crops have fared over time. Staying on top of crop production valuation trends at a state level and beyond can be beneficial for both you and your customers. Looking at trends over time gives you insights into how steady or volatile something is. Knowing this can help you make decisions that are aligned with your risk appetite.
- Permanent Plantings
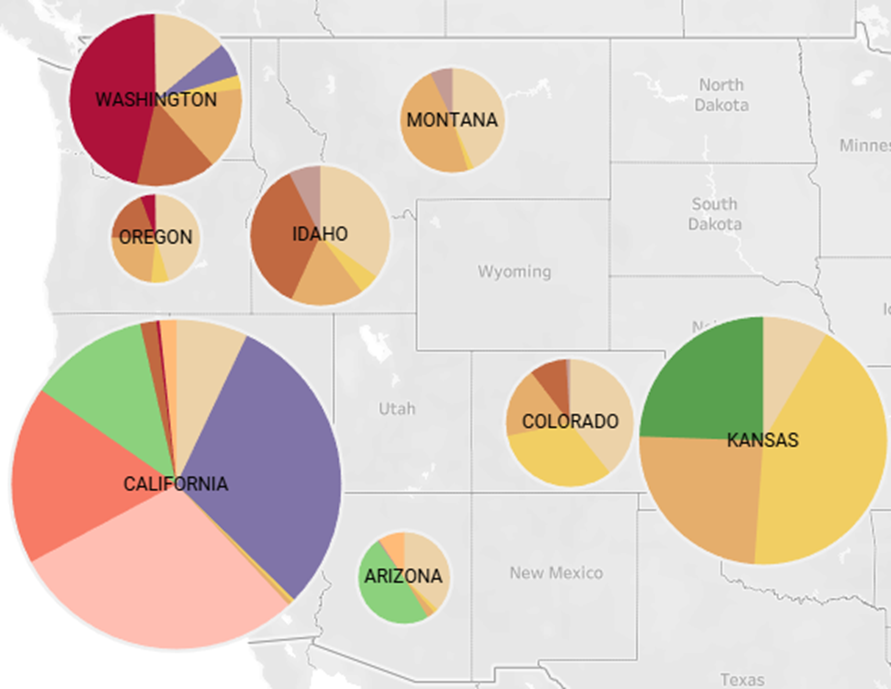
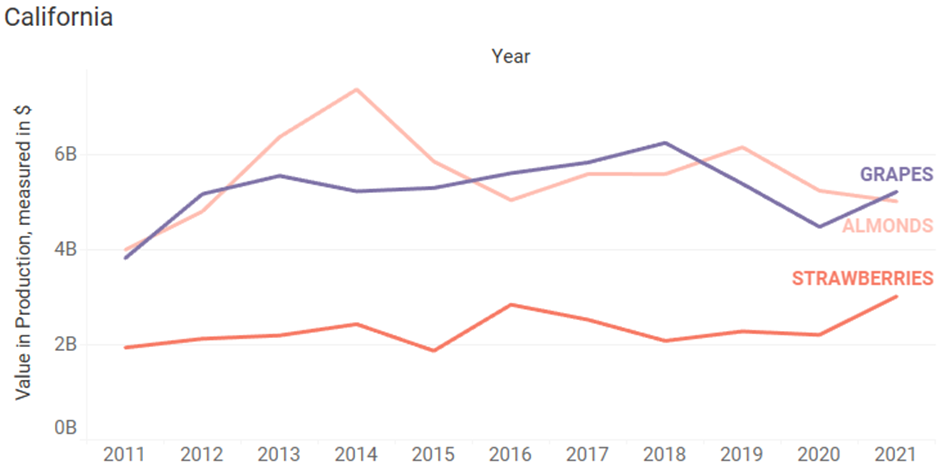
- Grapes and almonds in California have experienced a similar range in value for crop production over the past 10 years, though grapes were somewhat more steady where almonds exhibited more volatility.
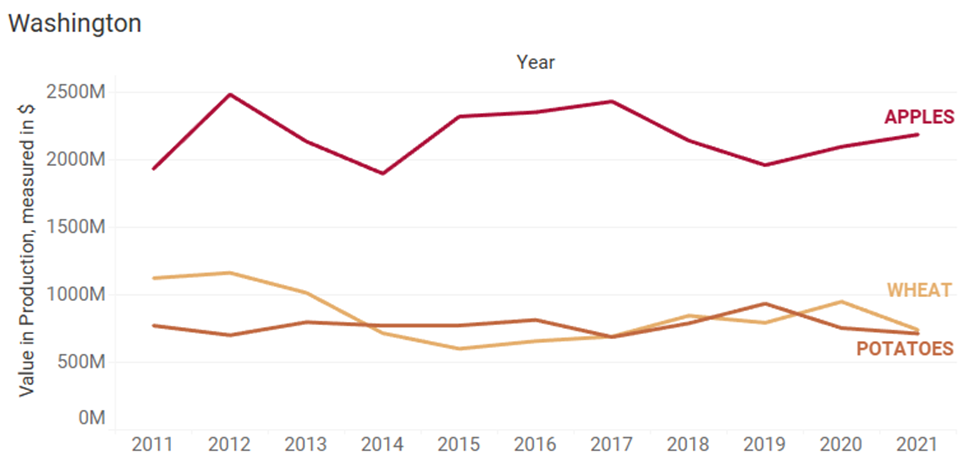
- Both of these, as well as apples in Washington and many other notable crops in the region, are permanent plantings. These crops carry higher risks than annual crops because they take years to establish before coming into full production.
- Fresh Market Produce
- Specialty Crops and perishable fruits and vegetables inherently carry a different risk profile and are generally associated with higher values or niche markets.
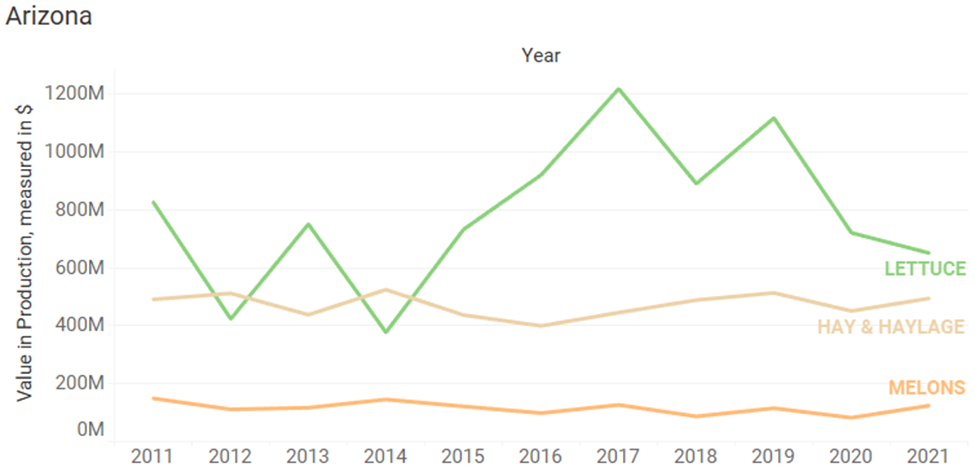
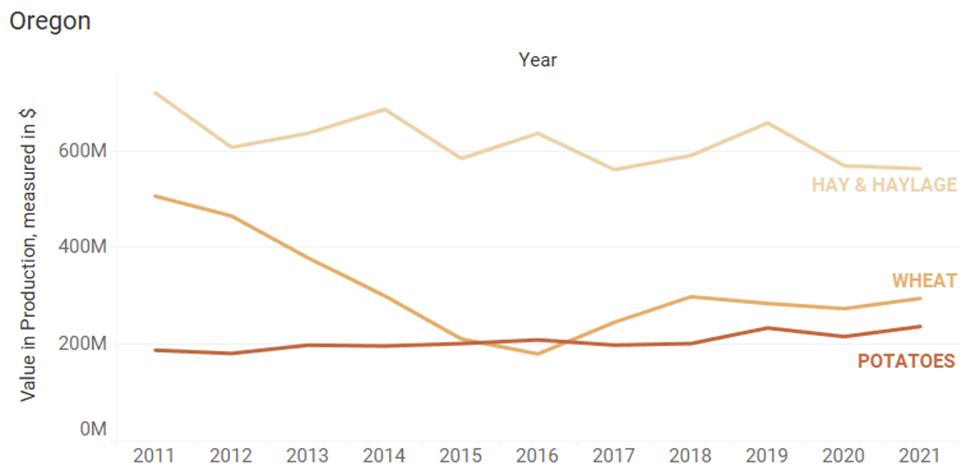
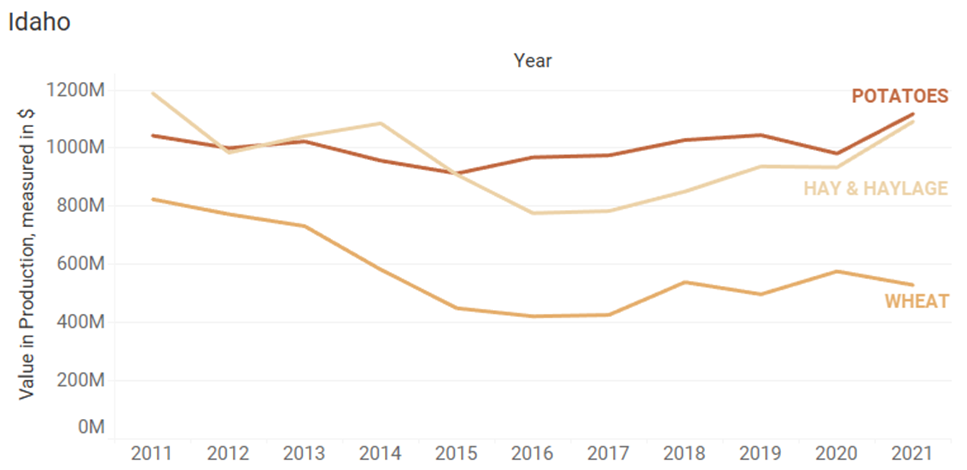
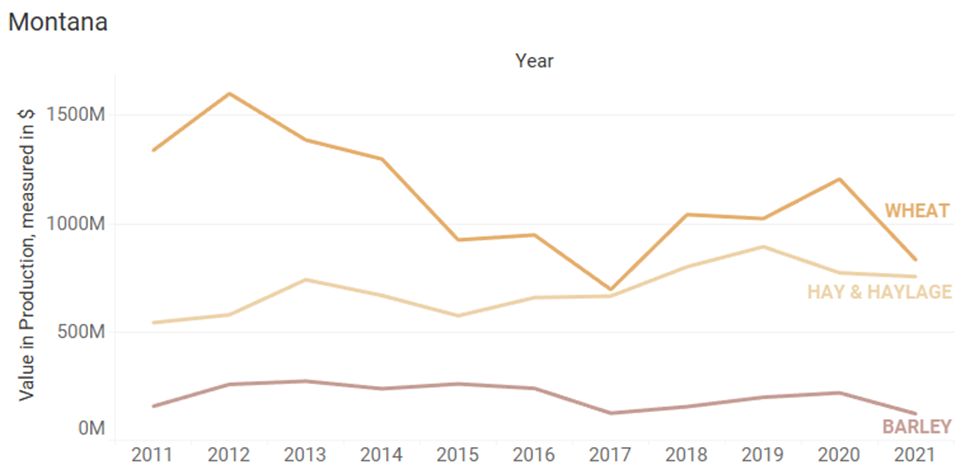
- Fruit such as strawberries in California and melons in Arizona have seen a relatively steady trend over the past 10 years. Potatoes which are famous in Idaho but are also commonly found in Oregon, Washington, and Montana, have also held a pretty steady 10 year trend. The trend for lettuce in Arizona, however, was more volatile which may require additional attention in your portfolio risk analysis.
- Commodity Field Crops
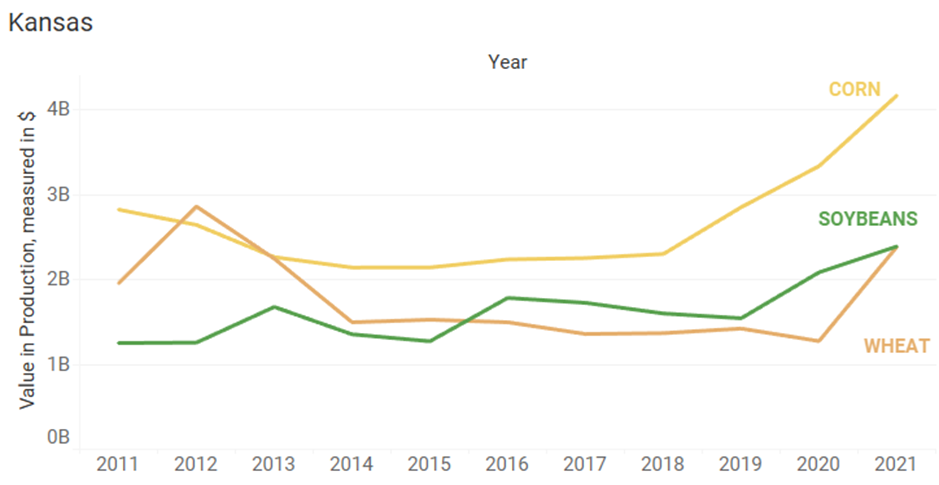
- Large swaths of land are required for commodity crops, so they are more common in less populated areas. Monocropping can deplete soils of vital nutrients, so it is common for farmers to utilize rotational crop plans or double-cropping to protect the productivity of the land. Hay, Wheat, Corn, and Soybeans are four of the most ubiquitous crops in the country. Kansas is one of the top producers of these crops.
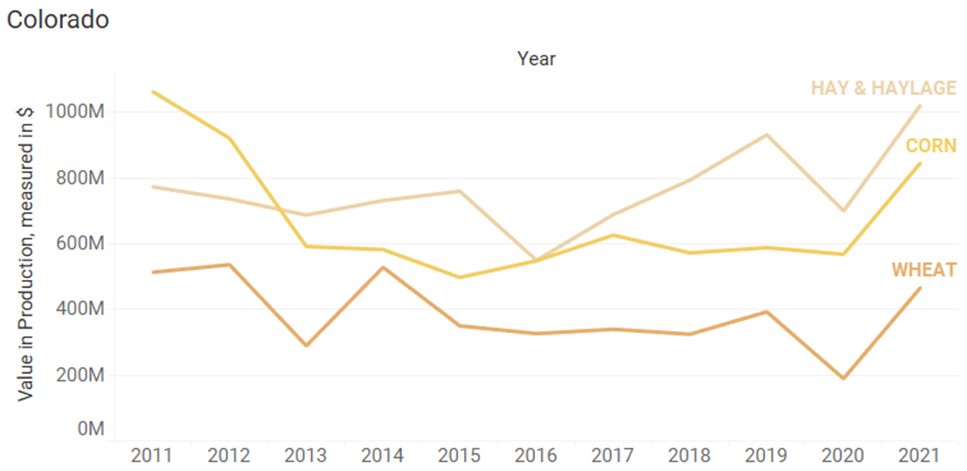
- Crop production valuation can be very similar for a single crop from state to state but can also widely vary from state to state. Corn, for example, has had a mostly increasing trend since the 2014-2015 timeframe in both Kansas and Colorado. Conversely, over the past 10 years the production value of hay and haylage in Oregon has been on a decreasing trend, Arizona has stayed relatively flat, and Colorado has been on an increasing trend. Knowing what’s happening in the areas of interest to you is key.
Here at Agcor we de-risk your portfolio, accelerate your loans, streamline your workflows, and always keep your data secure. We understand there are a variety of factors that impact crop valuation trends - such as environmental and regulatory factors. We created the following 10-year crop production valuation trend analysis as a customer love gift to you so you can continue to stay on top of agricultural industry insights.
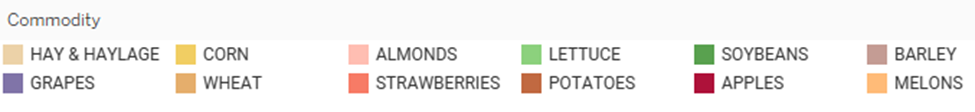
The below map shows the proportion of top crops for the eight states currently served by Agcor. The size of the pie charts on the map are based on the aggregate value in production, measured in US dollars.
The following pages detail the crop value production trends, along with other key statistics obtained from the USDA State Ag Overview for each state. The trend charts were based on the most recent 2011 to 2021 production data from this USDA NASS QuickStats query: https://quickstats.nass.usda.gov/3DFEE9C2-6BE4-3362-B472-24FAA8890BB4
Farm Area Operated, in Acres / Operation = 351
Farm - Number of Operations = 69,000
Farm - Acres Operated = 24,200,000
Farm Area Operated, in Acres / Operation = 1,379
Farm - Number of Operations = 19,000
Farm - Acres Operated = 26,200,000
Farm Area Operated, in Acres / Operation = 411
Farm - Number of Operations = 35,300
Farm - Acres Operated = 14,500,000
Farm Area Operated, in Acres / Operation = 423
Farm - Number of Operations = 37,100
Farm - Acres Operated = 15,700,000
Farm Area Operated, in Acres / Operation = 467
Farm - Number of Operations = 24,600
Farm - Acres Operated = 11,500,000
Farm Area Operated, in Acres / Operation = 2,137
Farm - Number of Operations = 27,100
Farm - Acres Operated = 57,900,000
Farm Area Operated, in Acres / Operation = 815
Farm - Number of Operations = 39,000
Farm - Acres Operated = 31,800,000
Farm Area Operated, in Acres / Operation = 780
Farm - Number of Operations = 58,600
Farm - Acres Operated = 45,700,000